How to Make a Color Mixing Chart With Your Own Paints
Rule a simple grid, mix every color you own with every other color, and add a second chart stepped with white. The result is a one-page reference showing exactly what your own tubes can do.

At a glance
Brushes and materials
- Small flat brush, about 1/4 in
- Pencil and ruler
- Palette and palette knife
- Two water jars
- Paper towels
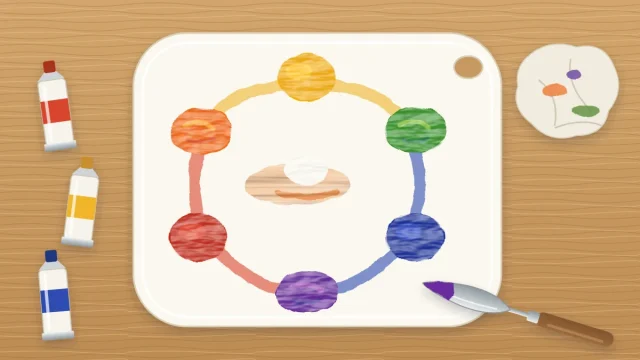
A color wheel in a book tells you what paint should do in general. A color mixing chart made from your own tubes tells you what your paint actually does, which is far more useful when you are standing at the canvas wondering how to get a particular green.
The chart is a simple grid. Every color you own is mixed with every other color, one square per pair, so a single sheet shows the whole range of your set. It takes an unhurried hour or two, uses very little paint, and stays useful for as long as you keep the same tubes.
What you need
- A sheet of acrylic paper or heavy mixed-media paper, about 9 x 12 in (23 x 30 cm)
- Six tube colors, plus titanium white for the second chart
- A small flat brush, about 1/4 in (6 mm) wide
- A pencil and a ruler
- A palette, a palette knife, two water jars and paper towels
Any six colors will do. A sensible set is primary yellow, yellow ochre, primary red, ultramarine blue, sap green and burnt sienna. If you own fewer tubes, make a smaller grid. A chart of four colors is still worth having.
Rule the grid
For six colors you need six columns and six rows. Draw the squares about 1 in (2.5 cm) across and leave a gap of roughly 1/4 in (6 mm) between them. The gaps matter: a strip of white paper around each square lets you judge the color on its own, and it stops wet neighbors from running together.
Leave a wider margin along the top and down the left side. Write the six color names across the top in pencil, one above each column, then write them down the left side in the same order, one beside each row. Keep all the writing outside the grid so paint never covers it.
Paint the pure colors on the diagonal
Find the squares where a color meets itself: first row and first column, second row and second column, and so on. They run in a diagonal line from the top left corner to the bottom right. Fill each one with unmixed paint straight from the tube.
These six squares are your anchors. Every mixed square can be compared with the two pure colors that made it, by looking along its row and up its column.

Fill the chart one row at a time
- Squeeze out a small amount of each color, about the size of a pea. You can add more later.
- Start with the top row. Take a little of the row color and move it to a clean spot on the palette.
- Add a roughly equal amount of the first column color and mix thoroughly with the palette knife until there are no streaks.
- Paint the square where that row and column meet. Use enough paint to cover the paper in one flat, opaque coat.
- Wipe the knife and brush on a paper towel, rinse the brush well, and blot it. Then mix the row color with the next column color.
- When a row is finished, change the rinse water if it has turned murky, and move down to the next row.
Working along a row keeps one color constant, which makes it easy to see how that color behaves with each partner. The basics of acrylic color mixing explain why some pairs stay bright while others go quiet. The chart simply puts the evidence on paper.
You will notice that every pair appears twice, once on each side of the diagonal. Mix both fresh instead of reusing a pile. If the two squares match, your “roughly equal” is consistent. If they differ, you have learned how far a small change in proportion moves the color.
Tip
“Equal” is judged by eye, and strong colors overpower weak ones. If a square looks almost identical to one of its parents, remix it with less of the stronger paint until it sits visibly between the two.
Add a second chart with white
The first chart shows hue. The second shows how each color behaves as it gets lighter. On a new sheet, or below the first grid, rule one row of six squares for each of your colors.
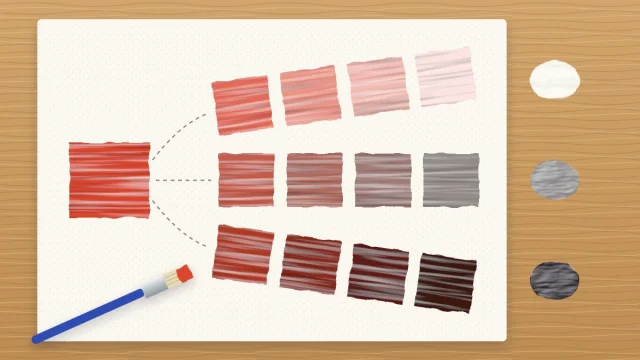
Paint the pure color in the left square. For the next square, add a little white to the mix and paint it. Keep adding white step by step, so that the row walks evenly from full strength on the left to a very pale version on the right.

Even steps are harder than they sound. The first touch of white often changes a dark color dramatically, and the last pale steps need far more white than you expect. For those, start a fresh pile of white and add color to it instead. What white does to a color, beyond making it lighter, is covered in the guide to tints, tones and shades.
Fixing common problems
- A square is streaky or thin. Let it dry, which takes roughly 10 to 20 minutes for a thin layer, then paint a second coat of the same mix.
- A mix is wrong. Let it dry and paint over it. Acrylic is opaque enough to cover a mistake in two coats.
- Colors look dirty. The brush is carrying the previous mix. Rinse longer, blot on a paper towel, and change the water.
What to notice when it is finished
Let the sheet dry fully, then look at it in daylight. Acrylics usually dry slightly darker than they look wet, so the dry chart is the true record.
- Which pairs make the brightest secondary colors, and which make muted ones?
- Where are the browns and grays? They usually come from colors that sit far apart from each other.
- Which tube dominates almost every mix? Use it sparingly when you paint.
- Which colors turn chalky or cool when white is added, and which stay lively?
Write the date in pencil on the back and keep the chart near your painting table. When a painting needs a dusty green or a warm gray, find the closest square and read off its row and column. Making a new chart whenever you add a tube is also a good warm-up to include in a regular acrylic painting practice routine.
Frequently asked questions
How many colors should a mixing chart have?
Use the tubes you actually paint with. Four to six colors is a comfortable size for a first chart, giving sixteen to thirty-six squares. More than eight colors makes a large grid that takes a long time to fill, so split a big collection into two smaller charts instead.
Should white and black go in the grid?
It is usually clearer to keep them out. White lightens every color in a similar way, so it works better as a separate chart of stepped rows. Black, if you use it, can have its own row of steps too, where you can see how quickly it dulls each color.
What paper is best for a color chart?
Acrylic paper or heavy mixed-media paper works well because it stays fairly flat under wet paint and is easy to rule with a pencil. Thin printer paper buckles and lets water soak through. A spare canvas panel also works, though pencil lines are harder to draw neatly on its texture.